"...when you can measure what you are speaking about, and express it in numbers, you know something about it; but when you cannot measure it, when you cannot express it in numbers, your knowledge is of a meagre and unsatisfactory kind; it may be the beginning of knowledge, but you have scarcely in your thoughts advanced to the state of Science, whatever the matter may be." ~ William Thomson, 1st Baron Kelvin (1824 – 1907)
Introduction
In physiotherapy and occupational therapy, the aims of intervention are usually to maximise function - to improve activity and participation in life situations. To evaluate whether intervention achieves these aims, therapists have a large number of measures available to them.However, evaluating outcomes is not as straightforward as it may seem. While measures might have been tested for evidence of their validity, reliability and responsiveness, recent developments in psychometric techniques have highlighted limitations in measures developed using older techniques. These limitations have an impact on the accuracy, reliability and validity of the scores themselves, and on the confidence with which we can evaluate the outcome of interventions and of research.
This blog aims to outline the differences between older and more recent psychometric techniques, and outline the common limitations in outcome measures which modern techniques can rectify.
Measurement: less straightforward in rehabilitation
We tend to take the number which outcome measures assign to the quantity we are measuring for granted, at face value. For example, measuring a quality such as weight, length or temperature is generally a straightforward procedure using the appropriate tools - scales for weight, a ruler for length or a thermometer for temperature. These variables are singular, discrete entities and we give little thought to the tools we use to measure them, and we take for granted the numbers associated with the measurement even when our health and welfare depend on them. We trust that the particular tool of measurement in each circumstance is valid i.e. there is good evidence that the scale adequately measures the variable for which it is intended to measure. We trust that the measurements it issues are reliable i.e. that the numbers produced by a scale to represent the quantity of the variable are consistent and reproducible every time, on every occasion and for each different person that uses it. Without this, baking books would be useless, and my Yorkshire Puddings would be very hit-and-miss*. We also trust in the responsiveness of the measure - a change of a degree Celsius in body temperature of a hypothermic or febrile child can be life-threatening so it is essential that the thermometer can capture this change.However, in many areas of health care we measure variables that are not so easily to directly measure - mood, anxiety, pain and functional ability, or we rely on subjective feedback. Methods of measuring these human characteristics include the use of questionnaires or checklists.


Traditionally, the reliability and validity of measures have been evaluated using Classical Test Theory (CTT). However, CTT is based on an unsound scientific basis because it is untestable, and is the cause of many limitations now recognised in many measures. This includes wide confidence intervals with the scores, which are always ordinal. More recent psychometric techniques such as the Rasch model offer a number of advantages over CTT. The Rasch model is a mathematical measurement model based on the fundamental scientific principles of measurement. A dataset formed from responses to questionnaire items are evaluated for their fit to the Rasch model. This determines whether the questionnaire meets acceptable standards required for scientific standards of measurement, and allows for the transformation of the ordinal outcome scores to interval level measurement.
Familiarity with these approaches to psychometric testing is therefore helpful if one is to attempt an evaluation of the essential properties and psychometric standards of the measures.
Developing and evaluating measures
Classical Test Theory
Classical Test Theory (CTT) is based on the theory that the observed score, which is based on the observation of a number of items that relate to the variable being measured, is made up of the true score plus any error. Because the error is random it cancels out leaving the true score. The problem with this theory is that this error is unknown and unobserved, and the evaluation of many psychometric properties in CTT rely on knowing this error.
Item reliability assumes that a good item produces an observed score that is closely related to the true score, and that this observed score varies across individuals (because the variable of interest varies across individuals) and varies across time in one individual e.g. after an intervention (DeVellis, 2006). There is an implication that both true and observed scores covary, and that a measurement of the strength of this covariance will provide an indication of the accuracy of the observed score (DeVellis, 2006). The measurement of the strength of this covariance, and thus the reliability of the measure, is called the correlation coefficient, which if squared gives the proportion of variance shared between the true and observed scores. However, the true score is unobservable, inseparable as it is from the error with which it is associated. CTT holds that a number of assumptions combine to address this problem (DeVellis, 2006). Firstly, the items must be strictly parallel, which is an assumption that comes with its own conditions e.g. items’ covariance with true scores must be equal across items and each item’s error must be independent both of the true score and of every other item’s error (DeVellis, 2006; page S51). This condition is itself unprovable, and therefore CTT is a theory that cannot be “tested, verified, or - more importantly - falsified in any dataset” (page 1098).
The measure is also only truly validated for the sample on which the psychometric testing was performed i.e. it is sample dependent.
These are the reasons proposed for the problems with measures described above. For example, because of the unknown qualities and quantities associated with the observed score, only the ordinal raw scores can be used for any statistical operations (non-parametric statistics), and the width of the confidence intervals for individual scores makes conclusions based on change scores between individuals very ambiguous. Also, DeVellis (2006) notes that ordinal scales show varying degrees of responsiveness along the scale from one extreme to the other (by as much as a factor of 15), something which will be illustrated when we explore the Rasch model. There are other psychometric issues with CTT: the inability to detect response bias (differential item functioning (DIF); and the scales produced are sample dependent. DIF exists when a sub-group within a population endorses responses to items differently to other sub-groups, therefore obtaining a different score even though they have the same amount of the variable being measured. An example of this might be pain or the level of discomfort due to a common cold when measured on a scale given to a group that includes both men and women: one might find that, despite the same level of discomfort, women might endorse items to obtain a lower score for each variable than men.Yes, a man flu detector.
DeVellis (2006) suggests that the nature of CTT-developed measures supports the use of less-appropriate items that contribute less satisfactorily to measurement, stating that “adding items can offset this problem and theoretically, just about any desired level of reliability can be achieved” (page S57). But these advantages do not counter the problems discussed above, and in fact adding items to improve reliability can add problems e.g. local dependency, which causes artificially increased scores.
The requirement in scientific and medical practice for high standards of measurement defines an outcome measure that is valid and reliable, invariant across samples, unidimensional, is free of locally dependent items and is free of DIF. The Rasch model is a mathematical model which offers the opportunity to perform parametric statistical analysis of item responses, thus allowing an objective evaluation of the items’ psychometric properties. Each item can then be modified to address the psychometric deficiencies or, if necessary, deleted altogether. Furthermore, because the Rasch model is based on fundamental scientific principles of measurement, it models the expected behaviour of the questionnaire response dataset for the questionnaire to achieve linear (interval-level) outcome scores.
There is nothing wrong with using ordinal data, and Classical Test Theory can only produce measures with ordinal outcome scores, but it is important to recognize the limitations. For one thing, there are varying confidence intervals of up to 30% with ordinal scores. Another major disadvantage is that the lines which divide the ordinal categories (e.g.Easy, Difficult, Impossible, or No Pain, Dull pain, Sore, Tolerable, Agony) are arbitrary and categories are not necessarily of identical width or quantity, even when that quantity can
be more accurately measured e.g. degree classifications. Moreover, a change in scores between two ordinal categories does not mean that the change two different ordinal categories in the same scale is equal. In fact, given the width of the categories, it is likely that sometimes a change will take place that goes unrecognized while in others, a tiny change will be seen as a change in scores. For example, a change of 8% from 61% to 69% would not change the category of a degree classification but a change of 1% from 59% to 60% would. Finally, although non-parametric statistical procedures which use ordinal data are pretty robust, they produce conservative results (because you cannot add, subtract etc - only rank the results in ascending order) that can affect the clinical and scientific significance of the findings.The requirement in scientific and medical practice for high standards of measurement defines an outcome measure that is valid and reliable, invariant across samples, unidimensional, is free of locally dependent items and is free of DIF. The Rasch model is a mathematical model which offers the opportunity to perform parametric statistical analysis of item responses, thus allowing an objective evaluation of the items’ psychometric properties. Each item can then be modified to address the psychometric deficiencies or, if necessary, deleted altogether. Furthermore, because the Rasch model is based on fundamental scientific principles of measurement, it models the expected behaviour of the questionnaire response dataset for the questionnaire to achieve linear (interval-level) outcome scores.
Problems with ordinal data
Even senior academics still make pretty basic errors with data, including averaging ordinal data and calculating standard deviations - it's just wrong, very wrong.
The recognition that ordinal data is misused, supports misinferences and is unhelpful to clinicians and researchers is not a recent advance (Merbitz et al., 1989, Stucki et al., 1996). The main problem with the use of ordinal data stems from its very nature, that of grouping similar levels of the variable being measured into different categories that can be ordered by size. The dividing lines between these groups are arbitrary (Merbitz et al., 1989) and each group is not necessarily of identical width or quantity, even when that quantity can be more accurately measured e.g. undergraduate degree classifications. Often, the different groups are given consecutively-numbered identifiers, and this potentially causes the main problem: that of treating each category as being numerically equal. This is not a property of ordinal data. For example, the Manual Ability Classification System is an ordinal classification system with five categories of ascending mobility limitation. Categories, or levels of mobility limitation, are numbered from I – V. The ordinal nature of the GMFCS means that there is increasing mobility limitation as the levels increase in numerical value i.e. Level I describes less mobility limitation than Level II. However, a change from Level I to Level II does not necessarily represent an equal change of mobility as a change from Level II to Level III.
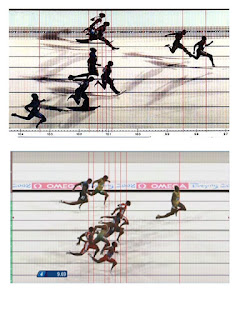
Ordinal data can influence health and research outcomes with this misinference (Merbitz et al., 1989). If a child who was positioned near the top of Level II received an intervention that caused a small improvement in mobility – just enough to take them into Level I, this would indicate success for the intervention; however, the results of an intervention that caused a child’s mobility to progress from the bottom of Level II to the top of Level II would indicate failure of the intervention despite potentially greater improvement in mobility. A clearer example of this problem is illustrated in Figure 3-1 below. This shows the photo finish of two 100 metres sprint events. For the athletes in third place to achieve a silver medal, one of them will have to work somewhat harder to make this transition to the higher ordinal category; furthermore, even if they each run faster by a second, equating possibly to a 10% improvement, they might still not achieve the improvement in ordinal outcome measures if the second place athlete also improves. The impression given by First, Second, Third is of equal intervals, and ordinal data is commonly treated this way.
Hobart and coauthors draw attention to the possibility that the confidence interval of an ordinal outcome score for individuals can occupy 30% of the available range of the scale, suggesting that a remarkable change in scores will be necessary before any significance can be attached to it. This has potential implications for the change in COPM scores that is regarded as clinically significant – a change of 2 out of 10. Hobart et al. (2007) further suggest that that ordinal scales are by their nature likely to be unresponsive. This could result in type-II errors. Arguments against more responsive scales include the likelihood of type-I errors but this is easily avoided by establishing a change score for the measure which indicates clinically significant change. Common sense suggests that for a measure to detect a clinically significant change in the characteristic being measured, its sensitivity and scale calibrations must be greater than that of the minimally significant change.
If ordinal-level outcome scores are unacceptable for health research, a psychometric model for establishing the fundamental properties for scientific measurement and interval-level measurement must be used. The Rasch model provides the opportunity to develop measures which meet these properties and to test for them in existing measures.
An outline of the Rasch Model
The underlying principle for the Rasch model is that being able to achieve a task, or pass an item (Yes or No), is influenced by both the difficulty of the task or item and the ability of the person. That is, the probability of a person endorsing, or ‘passing’, an item depends on how hard the item is and how much ability they have, and the hardest item on a measure will be endorsed or passed only by those with the greatest ability of the trait being measured. Endorsing or passing an item illustrates a specific ‘quantity’ of the trait being measured; therefore it is probable that all easier items will be passed or endorsed by that person, and also probable that items of more difficulty will not be endorsed. The Rasch model therefore resembles a probabilistic form of Guttman scaling.
Guttman scaling usually forms a deterministic pattern, as shown in the hypothetical example below. Items of increasing difficulty are passed up to a point where items become too difficult. This point varies depending on the ability of the person and how hard the item is.

The Rasch probabilistic model of the Guttman scaling, then, is less strict than the deterministic model and is the model against which the dataset from item responses of the measure undergoing psychometric testing is evaluated. This allows that, within a narrow border there is room for error. Outside of this narrow border, which is assessed for goodness of fit by a chi-squared test, items that do not fit do not meet the requirements for scientific measurement demanded by the Rasch model.
There is another important consideration, however - that of central tendency, here shown as the way that ability tends to cluster as a mean, with fewer people (of very poor and very high ability) at the extremes, and the greatest number of people (of average ability) in the centre. This is what produces the well known bell curve of a Normal distribution and gives us an ogive rather than the straight line shown in the Guttman scale example.

Here we can see how the ordinal scale (along the y-axis) can vary in responsiveness at different parts of the scale: a change of item difficulty scores from ten to twenty units and from a score of 40 to 50 units (i.e. a change of ten units for each) gives a change of person ability on a linear scale that differs by nearly 50% (i.e. from -3 to -1.6 and from -0.2 to 0.5 respectively), illustrating one of the problems with ordinal scores.
If the item responses show a good fit to the Rasch model the outcome measure that produced them is determined to have met the fundamental principles of measurement for achieving linear (interval level) outcome scores. Before removing misfitting items, though, it is essential to review the items - it is possible that a change in wording, or modifying the item activity, will bring the item within acceptable fit to the model. The analysis also evaluates person fit, and gives a strong statistical analysis of the targeting of the scale to the population and trait being measured, and whether the scale is targeting at a calibration to differentiate between individuals of different but similar ability. It is important to note that although Rasch analysis can identify psychometric problems with the items, and give guidance to how to address them, it is essential to give full attention and consideration when developing the items and their response categories - no amount of testing will overcome poor items.
Software used for performing statistical procedures to evaluate fit to the Rasch model (Rasch analysis) also tests a number of other measurement issues, all of which we have discussed above and are necessary for permitting transformation to interval outcome scores, and opens up the use of Rasch analysis to the wider community. It tests the internal construct validity of the measure, unidimensionality, the invariance of items (the measure is sample-independent), evaluates whether the ordinal response categories are working as expected (i.e. endorsed accurately according to the ability of the respondent), response bias (differential item functioning or DIF), and for local independence of items (when the response to one item influences the response to another item on the measure). This response dependency was mentioned as a problem with CTT. Finally, a Rasch analysis will evaluate the targeting of the scale: whether the scale possesses floor and ceiling effects, in which a section of the population being measured are off the scale at one or both extremes.
Other issues
Two other issues are important when evaluating the measures you are using. Some measures are developed to measure a trait across a broad range of conditions (generic measures). Beware that these are likely to be unresponsive to change.Round up
This, my first ever blog, describes common limitations with outcome measures. All measure should have evidence of their reliability, validity, responsiveness, unidimensionality, invariance, absence of local dependence and response bias; floor and ceiling effects should be described if they have not been addressed. There are compelling arguments against the use of ordinal outcome scores, which have wide confidence intervals and which vary hugely in their responsiveness along the scale.
Item Response Theory in the form of Rasch analysis has demonstrable advantages over Classical Test Theory for developing and testing outcome measures, such as determining that the outcome measure meets the fundamental principles of scientific measurement that permit transformation of the ordinal outcome scores into linear (interval level) measurement.
* (For Yorkshire puddings, the key factors are: pre-heating the oil; keeping the oil hot on the cooker while adding the batter; and leaving the oven door shut for at least 15 mins after they go in). You're welcome.